Forta Risk

Continuous oversight of everything your assets depend on

Every dependency, direct or several hops away, quantified in USD and monitored block by block.

For asset issuers, asset managers, curators and protocols

Live dependency graph

Smart contracts, admins, oracles, bridges and collateral.

Exposure in USD

Priced per dependency.

Real concentration risk

Aggregated across indirect paths, not just holdings.

Blast radius and contagion

What breaks when one fails, and how far it spreads.

Configurable risk exposure limits

On any node in the graph, at any depth.

Real-time alerts and exploit detection

Triggered as events unfold. To your inbox, your systems or your dashboard.

The problem

Dependencies you don't control
Every token, vault and position relies on a combination of smart contracts, admin keys, protocols, oracles and collateral. Some of these relationships are hidden and indirect.
Failures propagate fast
When one component fails, losses can move downstream within seconds.
No continuous view of risk concentration
Point-in-time analysis becomes stale as new dependencies emerge, prices fluctuate and balances change.

How it works

Forta maps every direct and indirect dependency as a graph, quantifies their exposure and keeps it current block after block.
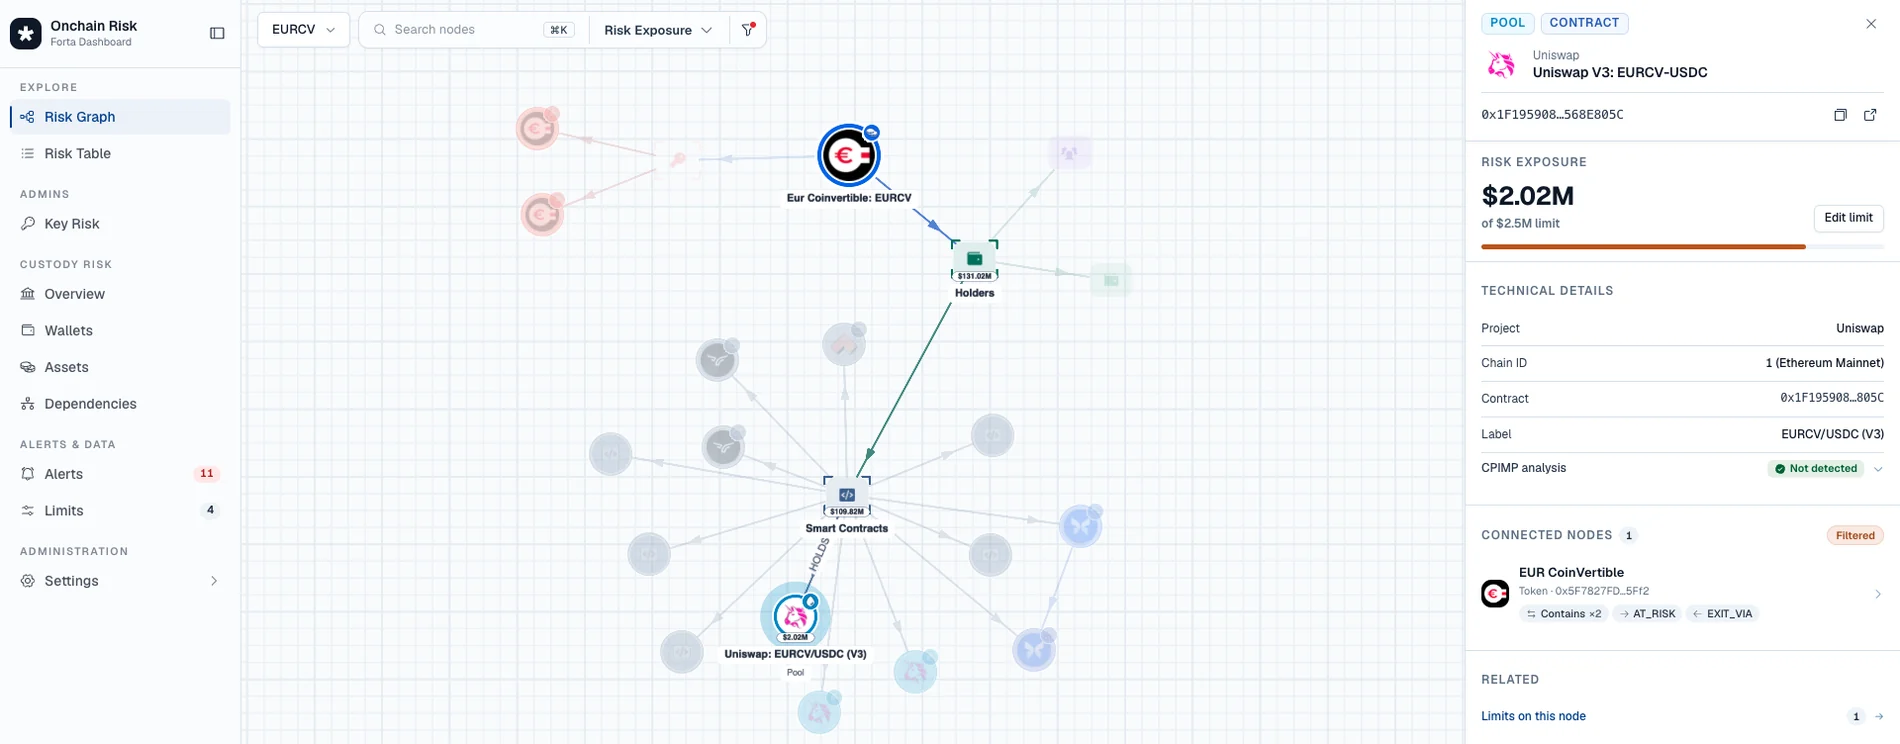
Forta Risk — Risk Graph
Forta Risk interactive exposure graph showing a token's direct and indirect dependencies, with a selected multisig node and its USD risk exposure against a configured limit.

Select any node to see its attribution, owners, USD exposure against your limit, and the dependency path that connects it to your position.

Attribution

Hundreds of thousands of labels resolve each node to the protocol, admin, or wallet behind it, with your own private labels overlaid on top.

Configurable risk limits

Set exposure thresholds. Forta alerts on breach and shows the dependency path that caused it.

Event monitoring

Admin changes, proxy upgrades, new collateral, large movements, concentration spikes, depegs, liquidity crunches, mints and burns. Delivered by email, webhook or alert feed.

Exploit detection

Forta's proprietary detection catches exploits in real time, and the graph tells you instantly how much of your exposure sits behind the affected entity.

How you consume it

The same graph and the same alerts, available three ways.

Dashboard

Interactive graph, risk tables, node detail and a filterable alert feed. CSV and PDF export for committee and regulatory reporting.

API

REST endpoints for the graph, exposure metrics and alerts, plus signed webhooks so events land in your existing systems.

MCP server

Connect Forta to Claude, ChatGPT or your own internal agents and ask questions in plain language, answered against the live graph. No query language to learn.

Built for institutional requirements

Single sign-on (SAML / OIDC) Role-based access Full audit trail Private by default Continuity & incident response

See your exposure before it becomes a loss

Request a Demo